
Many cutting-edge laboratory instruments are exquisitely sensitive to “energetic contaminants” like vibration, noise, and electromagnetic interference. It’s not always easy reading and interpreting these criteria; they’re sometimes confusing even to vibration consultants. But to be honest, it’s not easy developing them, either.
Where do these criteria come from, and what do they mean? It’s probably better to ask: how do realistic criteria—based on engineering data and multivariate testing … accepted by marketing and sales … approved by legal … understandable by consultants … achievable in real buildings—get set?
There are a lot of ways to develop criteria. Any realistic criterion will have to balance stringency with sales. Customers aren’t happy with tools that are too sensitive to work with, and grant money won’t buy an instrument that requires an extraordinary additional investment in mitigation measures. This means that there is considerable pressure on toolmakers: they have to make their products robust enough to be usable in the real world. The criterion you receive from the vendor is the product of compromise between all sorts of parameters.
Here, I want to introduce a simplified example to help non-practitioners understand what goes into a criterion. We’ll start with a hypothetical vibration-sensitive tool like an electron microscope for a nanotech lab or a processing tool for a semiconductor fab. We will pretend that there’s only one contaminant parameter (floor vibration) and one kind of problem associated with it (“errors”).
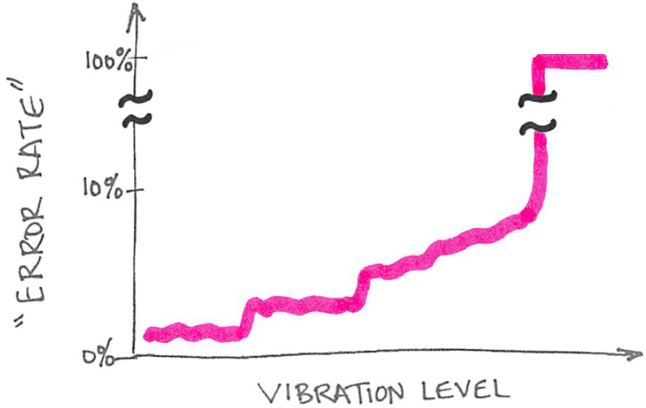
We might test the tool by subjecting it to different vibration levels during operation, noting the error rate at each level. With this framework, we could develop an “error-vs-vibration” curve like this:

In this hypothetical example, an error rate climbs with vibration level.
Real tools will exhibit more-complex sensitivities, like directional- or frequency-dependence and possibly some sort of timescale effect. Likewise, real interference might take any number of different forms, from loss of resolution to reduced throughput to poor yield. In this example, we have collapsed all of those parameters in to a “vibration level” and an “error rate” for the sake of simplicity.
We can easily see the effect of vibration in the plot above. Generally, as the vibration level increases, the error rate increases. At some level, the tool becomes useless as the error rate soars to 100%. At lower levels, the error rate exhibits some nuance. Most real tools probably behave similarly, with a domain over which errors might more-or-less rise with floor vibration until —at some critical level —the instrument rapidly approaches total failure.
An acceptable error rate will depend largely on market needs. For example, a university lab group might be willing to stomach poor throughput or middling sample-to-sample accuracy if they’re trying to image something that’s never been seen before. Conversely, a chipmaker won’t pay much for an inspection tool that misses lots of defects if better-performing tools are available.
But market needs aren’t the only parameter that might go into a criterion; economic and physical reality will play a part, as well. We never said anything about the scale of the x-axis in the above plot, but real buildings always exhibit at least some floor vibration. Achieving arbitrarily low vibration environments can quickly become arbitrarily expensive, and “zero vibration” doesn’t exist. We’ll discuss some of those realities in another posting about how vendors choose a criterion given this example.
Contact us if you need help developing or working with environmental criteria, whether for an off-the-shelf instrument or for a one-of-a-kind installation. We have consulting experience with toolmakers as well as research institutions, and we can help make your product or project more successful.