
A quick human-vs-rodent hearing comparison
Anyone who has designed animal laboratory spaces realizes that the animals have unique needs. One problem that comes up often with animal facilities is designing them for reasonable acoustics and noise control. Just like our human customers, we want our animal customers to have safe and comfortable places to live.
And in fact, we have been designing buildings for animal occupants forever; it’s just that the species has almost always been homo sapiens. That means we are awash in engineering data that are relevant only to human needs: acoustical data for everything from fan sound levels to duct attenuation to wall noise transmission to finish material absorption are all available, but (mostly) only at the frequencies that matter to people.
While it’s difficult to get engineering data for machines, materials, and systems, we can get some data on animal hearing. So, at least we can make educated guesses about what the animals are experiencing by paying attention to how their hearing differs from ours.
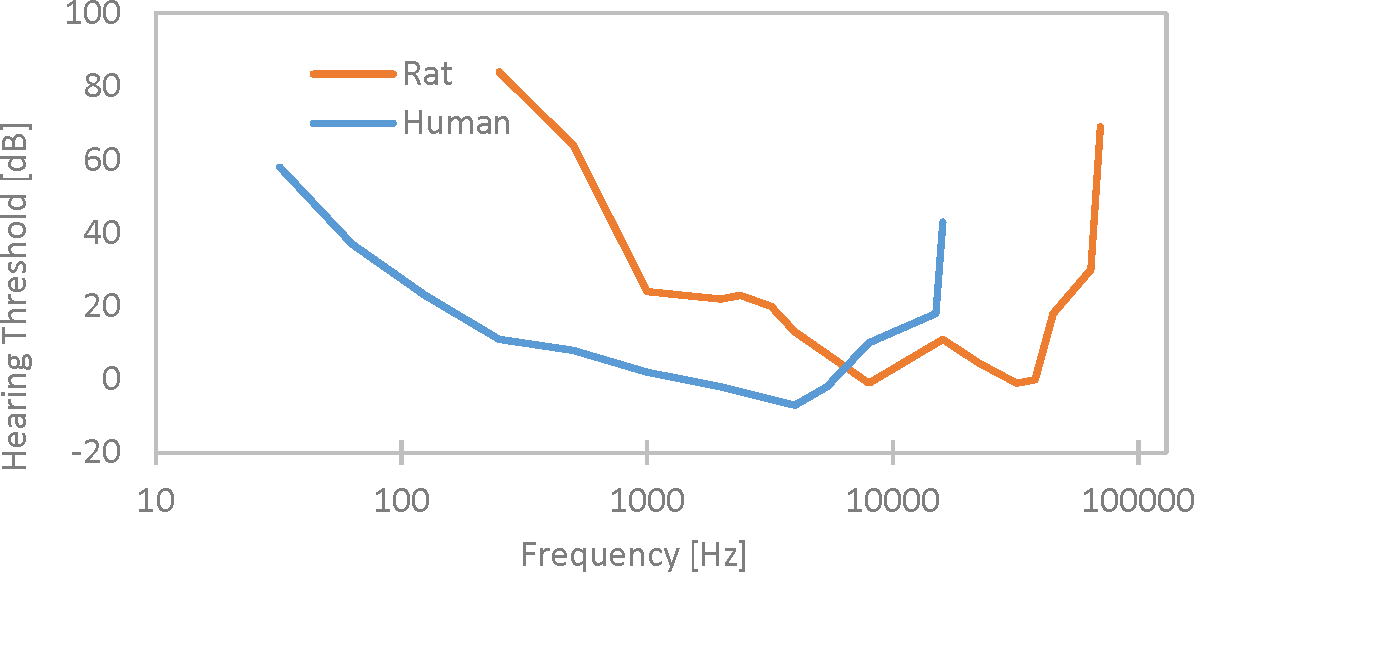
The plot above is called an audiogram: it describes the threshold of hearing. I’ve plotted humans (from an ISO standard) and a particular rat (from Rickye Heffner's fantastic archive of mammalian hearing data, available via the Internet Archive).
The figure is really simple to read: each point on the curve tells you the quietest sound that the animal can hear at different frequencies. So, for example, from the human audiogram you can see that people hear pretty well at 1,000Hz; here, the threshold of hearing is a scant 2 decibels. For rats, however, the threshold is more like 24dB. That means that a 20dB sound at 1,000Hz would be easily audible to you but would be entirely inaudible to the rodent. The very top end of human hearing, commonly taken to be 20,000Hz (which most people can't truly hear, anyway), is comfortably in the middle of the rat's hearing range, which stretches from a few hundred Hertz up to perhaps 70,000Hz.
One way that we could get a handle on rodent hearing would be to try to find some sort of “exchange rate” between the human and rat audiograms. It’s true that for much of the spectrum, humans appear to have better hearing than rats: you might notice that the lowest point on the human audiogram is actually below the lowest points on the rat audiogram. But this difference is not especially meaningful from our perspective: it’s a modest difference, and thresholds themselves don’t tell us much about what kinds of amplitudes might be annoying or painful, anyway.
Instead, the more important difference is frequency. And here is where my proposed exchange rate comes in. Forgive my poor web-animation capabilities; I’m going to show this in two parts. First, let’s separate out the x-axis (frequency) on the audiogram, so that we can keep an eye on what we're doing:
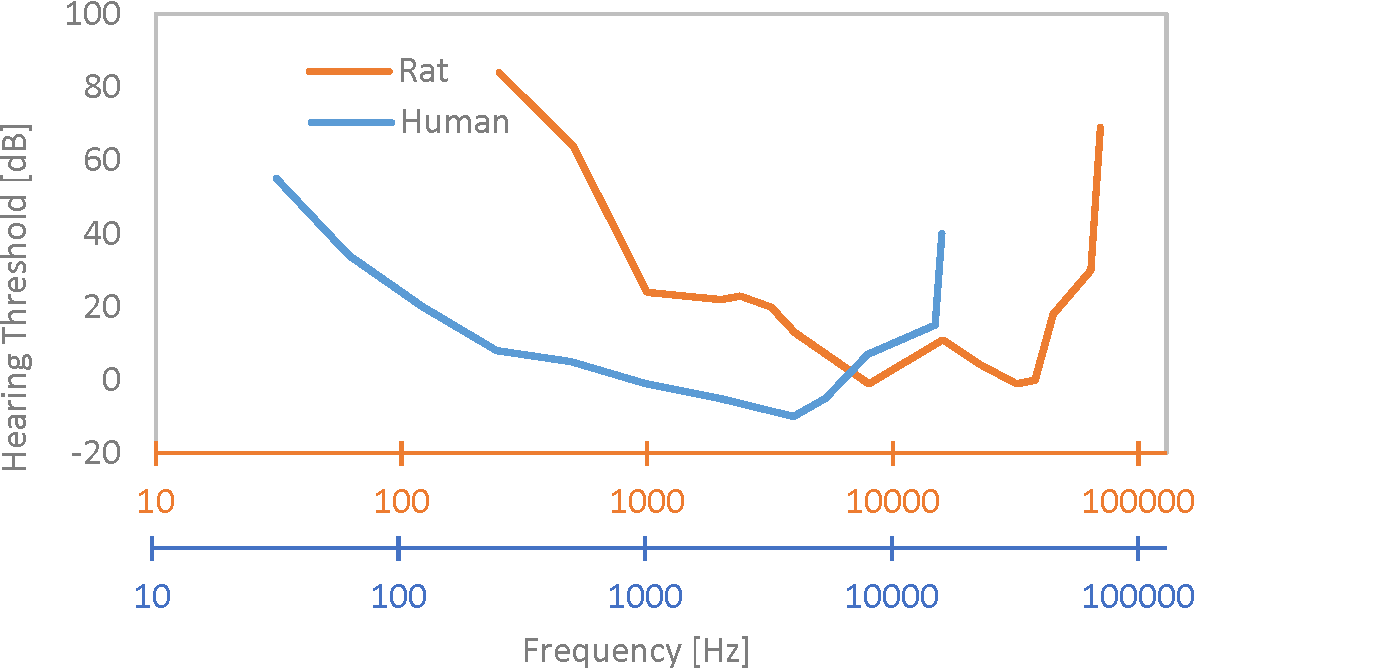
Now, we have one axis for rats (in orange) and another one for humans (in blue). Next, I’ll slide the two curves so that their shapes coincide as best as possible. Since the rat hearing is strongly biased to higher frequencies, this means that I have to slide the human audiogram far to the right:
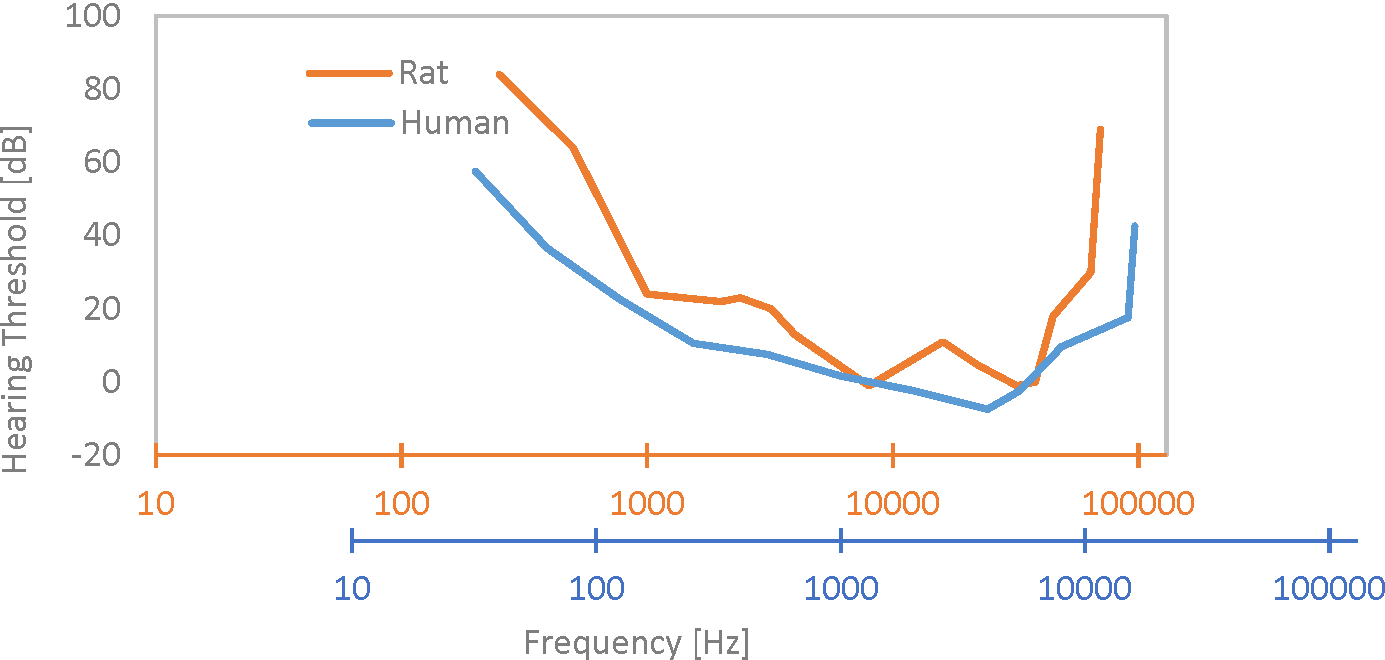
And there we have it: the audiograms overlap pretty well when we slide the frequency axis by a factor of about 6. Note that we didn't have to stretch or distort the frequency axis; all we did was slide them past each other. I'm sure you could come up with a more-sophisticated mapping, but it's a lot more straightforward to just keep that 6:1 exchange rate in mind: rats' experience of sound at 6,000Hz is probably pretty similar to your experience of sound at 1,000Hz.
So, if our rats ever develop their own tiny little Hi-Fi systems, they will design their adjustments for bass / midrange / treble at about 6x higher frequency than on our systems. And in the meantime, with this kind of thinking we can do a little better job designing facilities for our animal customers.