How instrument criteria are developed: regimes of interference

How instrument criteria are developed: regimes of interference

In a previous post, we wrote about how realistic laboratory vibration criteria for sensitive tools like electron microscopes could be developed from data relating performance to vibration level. Having real data is important for both customers and consultants, since non-physical criteria aren’t helpful to anyone. In this post, we discuss where a useful criterion might fall on that curve.

How instrument criteria are developed: “error-vs-vibration”

How instrument criteria are developed: “error-vs-vibration”

Many laboratory instruments are exquisitely sensitive to “energetic contaminants” like vibration, noise, and electromagnetic interference. It’s not always easy reading and interpreting these criteria; they’re sometimes confusing even to vibration consultants. But to be honest, it’s not easy developing them, either. So, where do these criteria come from, and what do they mean? We explore more in this blog post.

Building vibration: mechanical systems vibration isolation

Machine vibration isolation schemes fail for all kinds of reasons, ranging from conceptual problems to bad hardware selections to poor installation. So, how can you tell if mechanical systems' isolators are working? A formal test is expensive and requires a lot of planning and coordination. Here, Vibrasure has produced a video on a easy way to tell if the isolators are working.

Floor vibration: here's what different walker speeds look like

A Vibrasure produced video on floor vibration and walker speed. It turns out that pace is by far the most-important parameter in predicting walker-generated floor vibrations. So, how fast do people really walk in buildings, anyway? 

Environmental vs local sources of building vibration

We previously wrote about receiver-based vibration isolation systems – isolation pads or platforms that sit right below electron microscopes and other sensitive nanoscale imaging tools. In that discussion, we pointed out that these systems are more effective at reducing micro-vibration at higher frequencies than at lower frequencies. In fact, a major component of the vendors’ marketing materials is to demonstrate good low-frequency performance, often by citing a system resonance or "isolation frequency". Just like machine vibration isolators, lower is better.

This is important because many common imaging tools are more sensitive at lower frequencies. What’s more, floor vibrations in labs aren’t uniform across the spectrum: there might be more or less low-frequency content to begin with. But what governs how much energy we see at different frequencies in the spectrum?

Here’s an example micro-vibration spectrum. These statistics are based on data taken across the footprint of an aging university laboratory. Obviously, there is a lot more high-frequency than low-frequency vibration. While not shown here, the narrow…

Here’s an example micro-vibration spectrum. These statistics are based on data taken across the footprint of an aging university laboratory. Obviously, there is a lot more high-frequency than low-frequency vibration. While not shown here, the narrowband (high-resolution) data indicated that building machinery vibrations dominate at high frequencies. Based on the data, this site meets the “VC-C” criterion of 500 micro-inches/sec (12.5 micro-meters/sec); however, it could perform far better if mechanical system vibrations were addressed.

This “mix” of energy content in the spectrum isn’t completely random: different kinds of sources contribute to or even dominate different parts of the spectrum. The first and most obvious distinction between different "kinds of sources" is local vs. environmental.

Local vibration sources are those things in and around the building itself: machinery, foot traffic, structural/foundation systems, the parking lot. Environmental sources are those things external to the building: roads, transit lines, rail corridors, even the “seismicity” of the regional geology.

Here’s another example micro-vibration spectrum. These statistics are based on data taken at a proposed site for a university imaging center that would house vibration-sensitive electron microscopes. As you can see, there is a lot of energy down at …

Here’s another example micro-vibration spectrum. These statistics are based on data taken at a proposed site for a university imaging center that would house vibration-sensitive electron microscopes. As you can see, there is a lot of energy down at around 2Hz. Based on the data, this site meets the “VC-D” criterion of 250 micro-inches/sec (6.3 micro-meters/sec). There's not much you could do to improve this site, since the spectrum is dominated by ground vibrations arriving from outside the building. 


What is interesting about this differentiation is the degree of control that might be exerted over those sources. The owner of a vibration-sensitive laboratory building has far more control over local sources than environmental sources. During design and construction, the owner and design team can aggressively isolate new or existing building machinery or lay out the project so as to increase local distances between sensitive labs and vibration sources. But the owner typically has little or no control over environmental sources: traffic from city-owned streets or nearby rail systems might dominate, and nobody can do much to improve the regional geotechnical condition or alter the soil dynamics that determine long-range ground vibration propagation.

It’s true that a large entity like a university or a national lab will sometimes be able to influence the local authorities that operate and maintain nearby roadways or transit lines. Additionally, on large campuses the owner’s own roads might be relevant. These are important special cases, and the owner should use its resources and position to demand maintenance schedules or alignments that minimize the ground vibration impacts from these sorts of sources. But in general, you can think of environmental sources as things that are practically beyond anyone’s (straightforward) control.

It turns out that there is an important rule-of-thumb when it comes to micro-vibration frequency content from these two kinds of sources. In general, environmental sources tend to dominate at low frequencies, while local sources are often more important at higher frequencies. This is all down to physics: low frequencies travel farther in soil, so we don’t often see a lot of high-frequency ground vibration from far away; meanwhile, machinery vibrations are strongest at the RPMs of the shaft speeds, so building machinery creates the greatest vibrations mid- and upper-spectrum frequencies near 15Hz (900RPM), 30Hz (1800RPM), 60Hz (3600RPM), etc.

 
A decent rule-of-thumb for building vibration, including low-vibration labs and other engineered settings: environmental sources like traffic and nearby rail lines tend to dominate at low frequencies, while local sources like building machinery tend…

A decent rule-of-thumb for building vibration, including low-vibration labs and other engineered settings: environmental sources like traffic and nearby rail lines tend to dominate at low frequencies, while local sources like building machinery tend to control at high frequencies. Obviously, there are exceptions, but this is a reasonable starting point when trying to decide if a site can be made to work for sensitive uses like electron microscopy. 


This distinction is important because environmentally-driven building vibration is very difficult to mitigate against. So it’s important to be able to understand where those floor vibrations are coming from, and whether you have much ability to do something about them – other than moving to a low-vibration lab space at a remote location.

Floor vibration: how fast do people walk in buildings?

Update (March 2017): how fast do people really walk in real buildings? We produced a video to illustrate different walker speeds in important settings like laboratories, hospitals, and offices. Of course, some people walk faster or slower, but you might be surprised at where the centers of those distributions fall.

I've written recently about how to look at footfall vibrations created by people walking around in sensitive buildings like labs or hospitals. The theme of that post was that all sorts of the parameters and variables we care about are distributions rather than singular numbers. 

One of these is the walker speed, expressed in paces-per-minute (ppm). We're interested in walker speed because floor vibration response scales strongly with walker speed. In that earlier post, I suggested that these walker speed distributions might look conceptually like this:

Building occupants naturally walk faster or slower depending on setting. Clearly, people walk faster in corridors than in small rooms. Within those two categories, however, there is still some distribution.

Building occupants naturally walk faster or slower depending on setting. Clearly, people walk faster in corridors than in small rooms. Within those two categories, however, there is still some distribution.

Of course, I didn’t put any numbers on those distributions. So, what are some realistic walker speeds? 

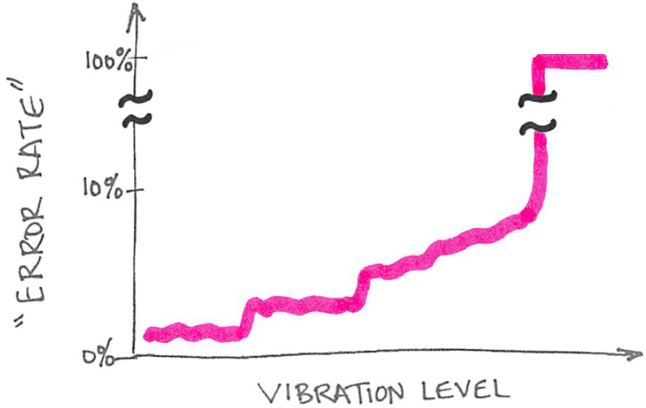
Everyone seems to have his or her own ideas, and that’s a problem for design or evaluation of vibration-sensitive settings like labs. Footfall vibration impacts scale dramatically – nonlinearly – with walker speed, so it’s important to get it right.

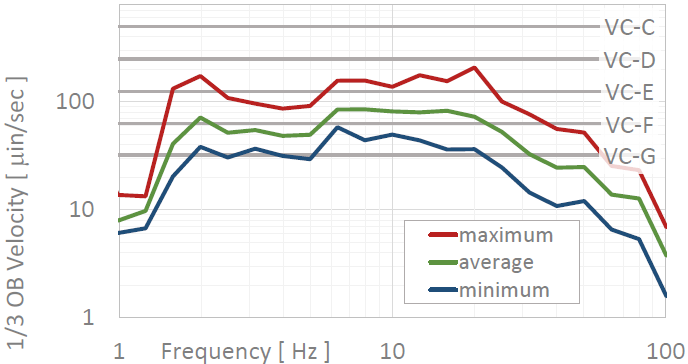
The standards don’t do a good job of clarifying this. The widely-used VC Curve system (discussed in IEST-RP-CC024 and IEST-RP-CC012) provides limits for different uses, but is silent on how fast people actually walk. AISC DG-11 discusses limits and also includes a calculation methodology, so walker speed and weight are part of the conversation. But DG-11 seems to suggest that “slow” walkers inside rooms move as slowly as 50 paces-per-minute. This seems unrealistic to me: download a metronome app, set it to 50 beats-per-minute, and try to walk around with the beat. 

People naturally walk faster in corridors than they do in small rooms, so it makes sense to acknowledge this fact in the structural vibration design. However, it seems like the "50/75/100ppm" regime for “slow/medium/fast walkers” as suggested in DG-11 can sometimes lead to anti-conservative floor structures.

If we take a statistical-distributional view of walker speeds and vibration impacts, it appears unlikely that any realistic lab or clinical space would house occupants walking on average only 50ppm. [Update (March 2017): here's where that walker speed video might come in handy.]


Byron has been measuring people walking around in buildings for nearly 20 years. Contact him if you’re worried about floor vibrations in your building, whether it’s a laboratory, office, or medical center.