I'll miss seeing that green jacket

Leo Beranek, 102, pioneer who unlocked mysteries of acoustics

I'm sure that everyone has his or her own story, but here's mine: I gave a talk at ASA (or maybe NoiseCon?) years ago. The subject eludes me, but I think it related to vibration rather than acoustics. Dr. Beranek was sitting in the very front row, in that green jacket that for some reason I always saw him wearing at conferences.

And after I'd finished my talk, he asked a Very Good Question.

I wish I could remember exactly what it was, but I recall it being deep: an inquiry into what something meant. I had purposefully avoided it in the talk itself because I wasn't yet sure that I had the right framework for interpreting it. And after a only high-level 15-minute presentation, Beranek had seen right through me. 

Maybe somebody should put together a "Beranek Number" system, modeled loosely on mathematicians' "Erdos Number".

A quick note regarding vibration and noise units

Just a quick note regarding expressions of vibration and acoustical data. Every now and then we come upon a vexing problem related to full expressions of the units of a measurement (or criterion).

I'm not talking about gross errors, like confusion of "inches-vs-centimeters" or "pounds-vs-newtons". Instead, I'm referring to some of the other, more subtle parts of the expression, like scaling and bandwidth.

Take a look at the plots below; this is from a vibration measurement in a university electron microscopy suite. Note that all of the data shown in this blog post are completely identical; however, they are expressed in different terms. I've re-cast this same singular spectrum in different terms so that you can see how much it matters to have a full expression of the units we're talking about.

To start, we surely won't confuse big-picture terms, like the difference between acceleration, velocity, and displacement. Which one you work with doesn't matter much, but we'd better be sure we understand the difference between them:

Data above are from a single measurement, expressed in acceleration, velocity, and displacement. Obviously, these units are all different, so the curves look different, despite the fact that each spectrum relates exactly the same information.

Data above are from a single measurement, expressed in acceleration, velocity, and displacement. Obviously, these units are all different, so the curves look different, despite the fact that each spectrum relates exactly the same information.

Also, we probably won't get fooled by the physical units, like inches-vs-meters. At the very least, we have a good "order-of-magnitude" sense of where things ought to land; if you have an electron microscopy suite with vibrations in double-digits, then they'd better be micro-inches/sec (rather than micro-meters/sec), or else you're in trouble:

The same data from before, now expressed using two different sets of units of velocity. Obviously, if you have a criterion like "0.8um/sec" then you'd better compare against the curve expressed in um/sec rather than the one in uin/sec. But…

The same data from before, now expressed using two different sets of units of velocity. Obviously, if you have a criterion like "0.8um/sec" then you'd better compare against the curve expressed in um/sec rather than the one in uin/sec. But are we finished? Do we have a complete expression of the "units" yet?

We're not quite finished, though. Just because we've agreed on terms (velocity) and physical units (micro-meters/sec), we still have some work to do. We never said what the measurement bandwidth should be. We've been showing narrowband data, but what if the criterion is expressed in some other bandwidth? Maybe it's not even a constant bandwidth, but rather a proportional bandwidth, like (commonly-used) 1/3 octave bands:

This is still all the same data, only we are now showing it in narrowband (1Hz bandwidth) as well as in 1/3 octave bands. Note that widths of the 1/3 octave bands scale with frequency as f*0.23, so at low frequencies (below 4Hz) the 1/3 octave band …

This is still all the same data, only we are now showing it in narrowband (1Hz bandwidth) as well as in 1/3 octave bands. Note that widths of the 1/3 octave bands scale with frequency as f*0.23, so at low frequencies (below 4Hz) the 1/3 octave band is actually smaller than 1Hz.

OK, so now we have terms (velocity), physical units (micro-m/sec), and bandwidth (let's choose 1/3 octave band). But we're still not quite finished: we still need to say what signal scaling we're using. You might have seen this referred to using phrases like "RMS" or "Peak-to-Peak":

Again, these are the same data as above, but now we've chosen the 1/3 octave band velocity in micro-m/sec. But if we're supposed to compare against a criterion, which scaling do we use? There's a big difference between the RMS, zero-to-peak, and pea…

Again, these are the same data as above, but now we've chosen the 1/3 octave band velocity in micro-m/sec. But if we're supposed to compare against a criterion, which scaling do we use? There's a big difference between the RMS, zero-to-peak, and peak-to-peak values. 

If I told you that the limit was 0.8um/sec, then would you say that this room passes the test? As you might surmise, you can't answer that question if all I told you that the limit was 0.8um/sec. You need to know exactly what I mean by "0.8um/sec". I know it sounds funny, but just plain micro-meters-per-second is not a complete expression. You have to tell me whether we're talking 0.8um/sec RMS; or zero-to-peak; or peak-to-peak. You'll also have to tell me what bandwidth you want: PSD? 1/3 Octave Band? Narrowband, with some specific bandwidth? 

If you were to tell me that you need to meet 0.8um/sec RMS in 1/3 octave bands, then we can plot the data appropriately and make some intelligent statements:

Since we've been given a full expression of the criterion (0.8um/sec RMS in 1/3 octave bands, which happens to be IEST's VC-G curve), we can plot the data with those units and overlay the criterion. This room passes the test, but without a full expr…

Since we've been given a full expression of the criterion (0.8um/sec RMS in 1/3 octave bands, which happens to be IEST's VC-G curve), we can plot the data with those units and overlay the criterion. This room passes the test, but without a full expression, we couldn't say one way or the other.

We see this kind of problem all the time. Most notably, we see people comparing narrowband measurement data against a 1/3 octave band criterion like those in the VC curves. This is just plain wrong, because the measurement and criterion are literally expressed in different units. The VC-G criterion isn't simply "0.8um/sec"; instead, it is actually "0.8um/sec RMS in 1/3 octave bands from 1 to 80Hz". 

This is important, and it matters a lot! 

Reciprocity: vibration isolation works the same, regardless of which way you look

Last month, I wrote about vibration isolator frequency, and why we have to pay attention to it when isolating rotating machinery (especially in highly-sensitive settings). That discussion centered around the notion of tuning between the spring and the machine it supports. This explains why -- in vibration-sensitive labs and fabs -- neoprene mounts are probably a terrible isolator choice for a 900RPM fan. Here, the isolation frequency is too close to the primary fan vibration frequency; they're "tuned" to each other, and the isolator acts like an amplifier instead of an attenuator.

It's worth pointing out that other tunings can happen, too. And they can be equally problematic. Not only can the isolator be tuned to the machine frequency; the system could also end up tuned to the natural frequency of the structure itself. 

You can think of these systems from two different directions. That earlier post looked at the machine isolation problem of a vibrating payload isolated from a sensitive structure. Now, however, let's invert the problem and say that the structure is the vibration source while the payload is sensitive; imagine an optical microscope sitting on a lab bench. The Principle of Reciprocity insures that all the same concepts apply to both.

Isolation systems act the same, whether you're trying to isolate the building from the payload (like a pump) or trying to isolate the payload from the building (like a microscope). If you understand one, then you'll understand the other. You can tha…

Isolation systems act the same, whether you're trying to isolate the building from the payload (like a pump) or trying to isolate the payload from the building (like a microscope). If you understand one, then you'll understand the other. You can thank Maxwell for figuring this out.

In our microscope isolation system, the same kind of problematic tuning can arise. If the structure's natural frequency matches the isolated system's natural frequency, then we're going to have problems.

Imagine that you're installing a microscope in a lab, and you choose mounts that result (via pad stiffness and microscope mass) in a 12Hz system resonance. That means that if you bump into the microscope, the entire isolated system will "ring," bouncing back and forth 12 times per second. What if the laboratory is on an upper floor of the building, and the structure -- unbeknownst to you -- also exhibits a natural frequency at 12Hz?  

Every time someone walks by, that 12Hz floor resonance is going to get excited greatly; since your isolation system is itself tuned to 12Hz, all that vibratory motion very efficiently finds it way into the microscope. In fact, those vibrations will end up getting amplified rather than attenuated, and your images are probably going to get a lot worse. The same thing would happen even if the frequencies aren't so perfectly aligned; the common wisdom is that the frequencies have to be separated by at least 40% to avoid strong interaction. 

So, even when you're isolating microscopes rather than machines, frequency still matters. I didn't choose 12Hz randomly; that's a common number for rubber-type mounts, and it's also common for vibration-designed laboratory floors. So, this isn't just a theoretical risk.

Everything has a natural frequency: the structural floor, the lab bench, the vibration-isolated system. Even the microscope itself has internal resonances; these are the reason why the instrument is sensitive to vibrations in the first place. And when it comes to vibration isolation, allowing these resonances line up (in frequency) is usually not what we want.

A quick human-vs-rodent hearing comparison

Anyone who has designed animal laboratory spaces realizes that the animals have unique needs. One problem that comes up often with animal facilities is designing them for reasonable acoustics and noise control. Just like our human customers, we want our animal customers to have safe and comfortable places to live. 

And in fact, we have been designing buildings for animal occupants forever; it’s just that the species has almost always been homo sapiens. That means we are awash in engineering data that are relevant only to human needs: acoustical data for everything from fan sound levels to duct attenuation to wall noise transmission to finish material absorption are all available, but (mostly) only at the frequencies that matter to people.

While it’s difficult to get engineering data for machines, materials, and systems, we can get some data on animal hearing. So, at least we can make educated guesses about what the animals are experiencing by paying attention to how their hearing differs from ours.

 
human-v-rat-audiogram-1
 

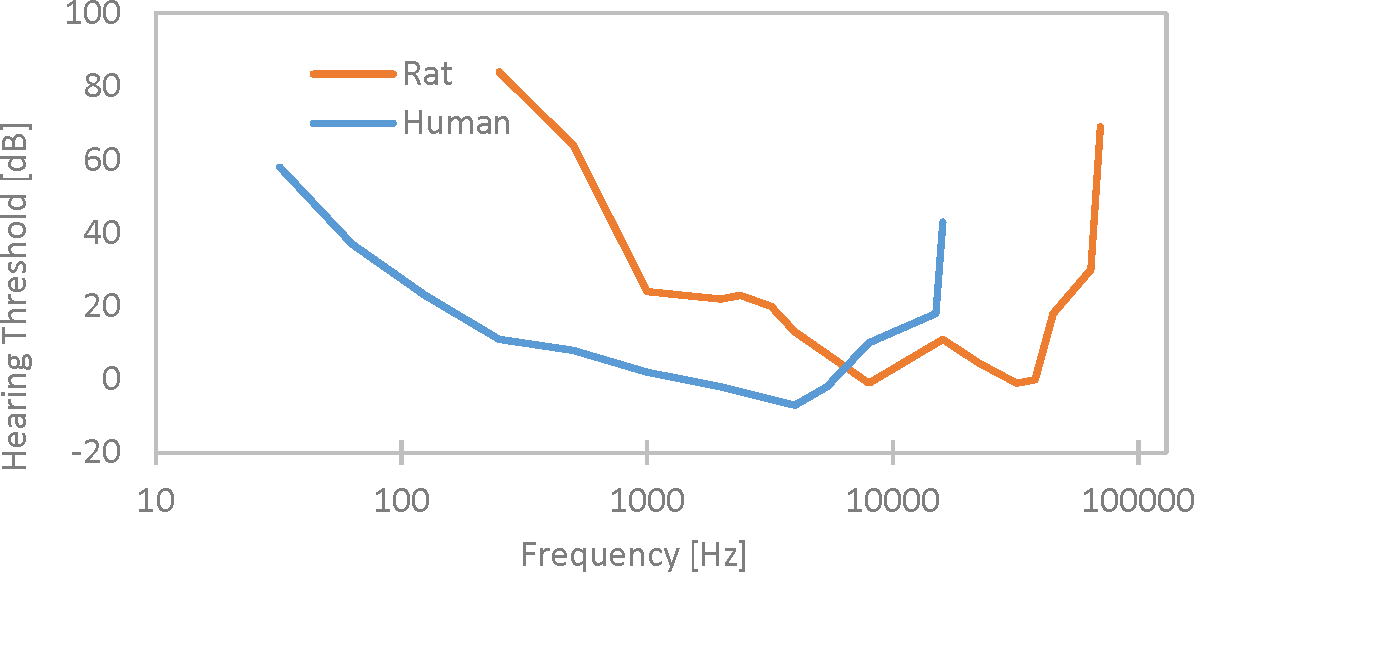
The plot above is called an audiogram: it describes the threshold of hearing. I’ve plotted humans (from an ISO standard) and a particular rat (from Rickye Heffner's fantastic archive of mammalian hearing data). 

The figure is really simple to read: each point on the curve tells you the quietest sound that the animal can hear at different frequencies. So, for example, from the human audiogram you can see that people hear pretty well at 1,000Hz; here, the threshold of hearing is a scant 2 decibels. For rats, however, the threshold is more like 24dB. That means that a 20dB sound at 1,000Hz would be easily audible to you but would be entirely inaudible to the rodent. The very top end of human hearing, commonly taken to be 20,000Hz (which most people can't truly hear, anyway), is comfortably in the middle of the rat's hearing range, which stretches from a few hundred Hertz up to perhaps 70,000Hz.

One way that we could get a handle on rodent hearing would be to try to find some sort of “exchange rate” between the human and rat audiograms. It’s true that for much of the spectrum, humans appear to have better hearing than rats: you might notice that the lowest point on the human audiogram is actually below the lowest points on the rat audiogram. But this difference is not especially meaningful from our perspective: it’s a modest difference, and thresholds themselves don’t tell us much about what kinds of amplitudes might be annoying or painful, anyway. 

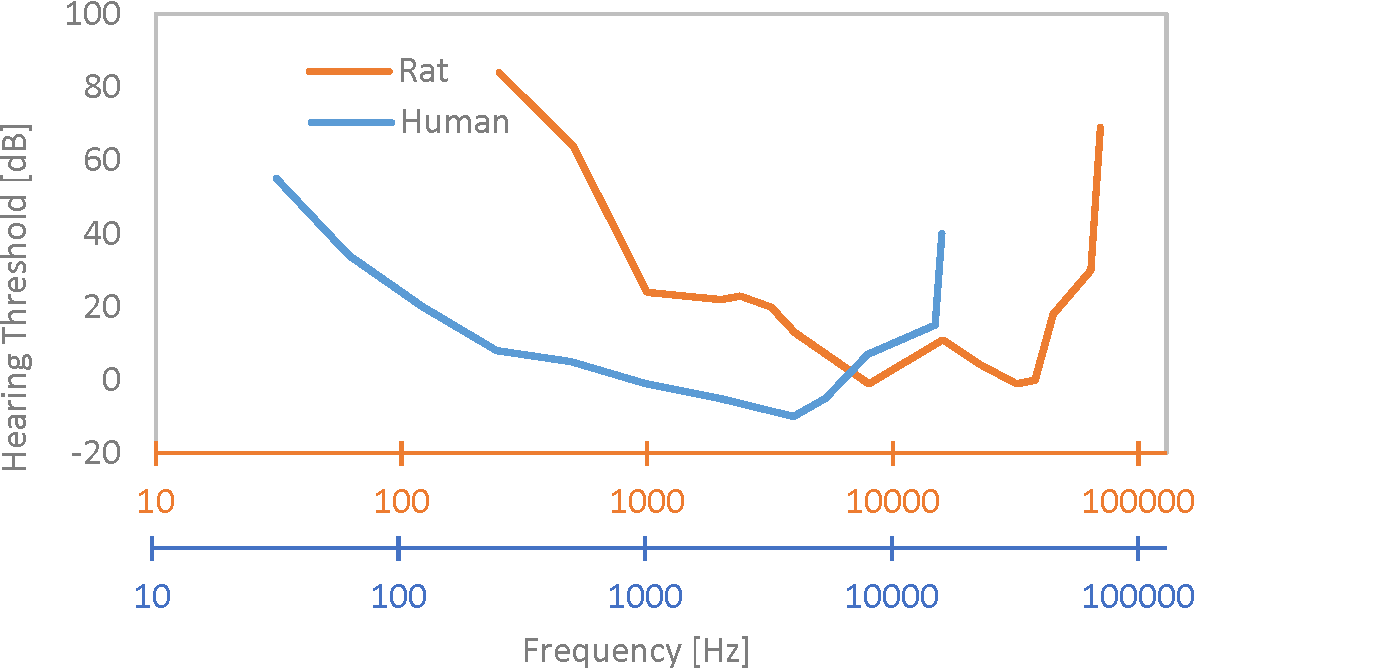
Instead, the more important difference is frequency. And here is where my proposed exchange rate comes in. Forgive my poor web-animation capabilities; I’m going to show this in two parts. First, let’s separate out the x-axis (frequency) on the audiogram, so that we can keep an eye on what we're doing:

 
human-v-rat-audiogram-2
 

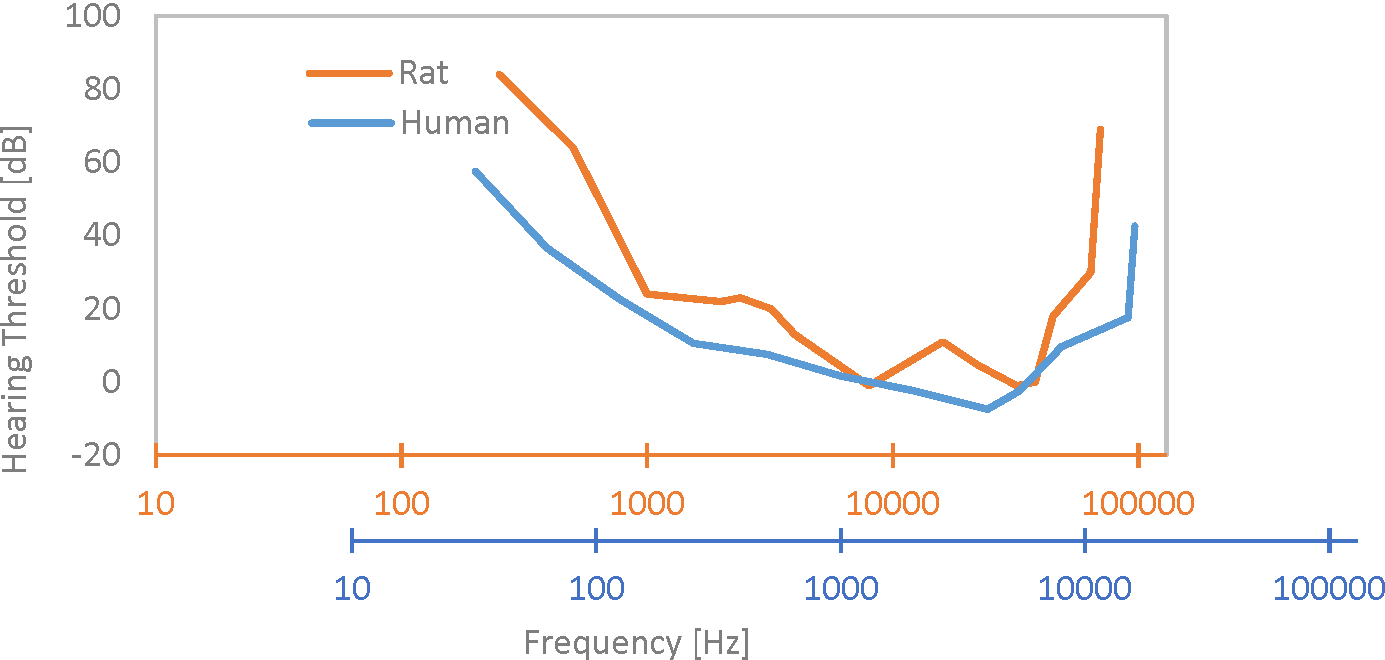
Now, we have one axis for rats (in orange) and another one for humans (in blue). Next, I’ll slide the two curves so that their shapes coincide as best as possible. Since the rat hearing is strongly biased to higher frequencies, this means that I have to slide the human audiogram far to the right:

 
human-v-rat-audiogram-frequency-scaled
 

And there we have it: the audiograms overlap pretty well when we slide the frequency axis by a factor of about 6. Note that we didn't have to stretch or distort the frequency axis; all we did was slide them past each other. I'm sure you could come up with a more-sophisticated mapping, but it's a lot more straightforward to just keep that 6:1 exchange rate in mind: rats' experience of sound at 6,000Hz is probably pretty similar to your experience of sound at 1,000Hz.

So, if our rats ever develop their own tiny little Hi-Fi systems, they will design their adjustments for bass / midrange / treble at about 6x higher frequency than on our systems. And in the meantime, with this kind of thinking we can do a little better job designing facilities for our animal customers. 

Machine vibration isolation failures

I've been writing a lot recently about machine vibration isolation, and it occurred to me that it might make sense to bring out a review article I wrote on failures in isolation systems.

I originally wrote this for a conference in 2010, and it ended up in Sound and Vibration Magazine as "Small Deviations and Big Failures in Vibration and Noise Isolation". It's still relevant, and it takes a high-level look at problems at all points, from concept design to isolator/hardware selection, to fabrication and installation. And while it's written from the perspective of high-end laboratories and imaging suites, the concepts are broadly applicable.

Part of what's vexing for machine isolation is the sheer number of options, and the fact that machine vibration impacts evolve over time. In contrast to the structural vibration design (for which there are only so many kinds of steel and concrete materials, concepts, and techniques), machine vibration isolation is heavily product-driven and sensitive to installation variability. And while that structure doesn't much change over the years, rotating machinery encounters wear-and-tear while isolators don't always stay in alignment. 

It's no surprise that all isolator products are not created equal; quality and performance can vary considerably from vendor to vendor. What might not be obvious, however, is the degree to which "robustness" matters in the face of realistic installations. Many isolator concepts and products work very well in principle, but age poorly or demand impossibly-perfect installation conditions / workmanship. Since we want the building to work well not only at startup but also many years into the future, it makes sense to pay attention to these issues.  

Anyway, take a look at that article if you're interested in good machine vibration isolation. And if you want to bounce some ideas off of me, note that the contact information given in that paper is now out-of-date.

Why vibration isolation frequency matters

I've written a lot about the isolators that we make use of on vibration-sensitive laboratory projects (including the variety of ways that things can go wrong). These are supports like the big steel-coil springs that you've seen pumps and fans sitting on:

Above: an unhoused steel spring from Mason, which I just learned can be purchased on Amazon, of all places (sadly, it's not eligible for Prime).

Above: an unhoused steel spring from Mason, which I just learned can be purchased on Amazon, of all places (sadly, it's not eligible for Prime).

If you are mechanically- or electrically-inclined, it's natural to think of these elements as presenting an impedance discontinuity at the support. That means that some frequencies "reflect" off of the discontinuity, their energy (mostly) doomed to stay trapped in the machine instead of spreading into the building. However, that also means there are some frequencies at which the spring is acting as an impedance-matching element, and it actually helps (rather than hinders) the transfer of vibrational energy into the structure. That's what's happening at the resonance, and it makes matters worse instead of better.

This is why we are usually leery of neoprene-style isolators in highly vibration-sensitive settings like nanotech labs or buildings with high-end imaging suites.

Most neoprene mounts are 12Hz (or so) isolators. Remember, though, that a "vibration isolator" only isolates at frequencies above 1.4x the spring resonance. And all isolators of this sort provide more attenuation at higher frequencies, and less attenuation at lower frequencies. That means that neoprene is great for acoustical problems: a 12Hz isolator might provide attenuation for frequencies as low as 17Hz (12 x 1.4). That's well below most people's range of hearing, and it's operating pretty well by the time you get up to the frequencies that people hear easily.

But a 12Hz isolator isn't helping much on any machine operating below about 1200RPM, and it's actually amplifying vibrations from slower machines

Above: a quick comparison of vibration isolation effectiveness for a double-deflection mount and an unhoused steel spring. In general, these isolators perform better at higher frequencies and worst at lower ones. The neoprene mount is fine for …

Above: a quick comparison of vibration isolation effectiveness for a double-deflection mount and an unhoused steel spring. In general, these isolators perform better at higher frequencies and worst at lower ones. The neoprene mount is fine for many applications, but when you need a lot of attenuation or have intense vibration sensitivities, then it's hard to beat springs.

That's right: if your fans run at 900RPM, you might be better off just bolting them directly to the structure rather than using neoprene. The neoprene might reduce some of the audible (higher-frequency) fan noise, but it's only making structural vibrations worse. And remember, lots of systems these days run on VFD, meaning that your 1800RPM fan might sometimes operate at 900RPM when demand is low.

So when your vibration consultant tells you that he or she really thinks you should use springs instead of neoprene pads for something, there's probably a reason! Frequency matters, and it's actually possible for the wrong kind of "isolator" to make building vibrations worse instead of better.